Pourquoi lire cette publication peut vous être concrètement utile ?
You are about to test the RAG to “ask questions of a document database”. Or rather: you’ve just tried these solutions and are a little disappointed? Here’s an opportunity to look back at the fundamental flaws in these approaches, and to see what recent academic research can offer.
If you only have a minute to devote to reading now, here's the essential content in a nutshell
- The RAG still suffers from fundamental flaws in industrialization, observed by all engineers who dabble in the subject.
- In 2024, Microsoft proposed a new approach called GraphRAG, promising better structuring of information.
- GraphRAG is also a massive approach, but generates a hierarchy of graphs on the information discovered, enabling it to be better localized.
- Nevertheless, it remains difficult to estimate the quality of these approaches in the absence of real, validated benchmarks.
- MediGraph RAG is a more recent and very interesting approach, in that it is less generic and more specialized in one domain, in this case medical literature.
This approach provides interesting keys for exploiting an available knowledge graph and building a new graph from the literature.
- Finally, we give another example of an approach using an already available graph linking documentary elements.
GraphRAG?
Structuring and exploiting a document database with AI? “Ask questions to a document database”, to quote a promise often made in the dreamlike marketing world of Linkedin? Visit RAG (Retrieval Augmented Generation) has been in vogue for several years now, but it has to be admitted that this approach remains open to criticism. Since the original publication of Meta AI, attempts to implement it in industry were more failures than successes, while the academic world continued to propose new, more or less original solutions…
We’ve already pointed out the problems with this approach many times, but considering the subject of this article, it’s worth repeating :
- Original approaches trained a model on the document base, which runs counter to application approaches: nobody wants to re-train a model every time a new document appears.
- The RAG approach often leads to very disparate results… In some cases it works, in others it doesn’t. And the proud but aware data-scientist knows only too well that there is no solution to correct anything.
- The RAG approach aims to identify the elements (chunks) in the document base via pre-filtering and cosine similarity, and then inject them into the LLM context. Cutting and structuring these elements is fundamental (beyond simple line-by-line cutting), but the solutions are not obvious.
Relevant in its promise of value (everyone has a document base as valuable as it is ignored), but lacking in its results, the RAG has been the subject of numerous proposals for technical improvements. Today, we’d like to take a look at a trend that’s making more and more noise: the GraphRAG. Is combining the pleasant mathematical objects of graphs with RAG approaches finally breaking the deadlock? Here’s a quick research update on three fundamental publications from the last two years.
From Local to Global: A GraphRAG Approach to Query-Focused Summarization, Edge et al, Microsoft
This scientific publication, from Microsoft Researchis considered the founding publication of the GraphRAG. The central argument given by the authors relates to cases where we want to ask a question requiring a “complete” understanding of the dataset. For example, if we imagine a documentary corpus of publications over ten years, we might want to extract the main themes across all these publications. And in such cases, classical RAG approaches are unable to work, since they start by extracting a subset of the corpus. dataset which, in fact, cannot contain all the information needed to respond.
More generally, the GraphRAG is part of a line of work that seeks to exploit a graph structure to apprehend a set of information. The graph is a very simple and rich mathematical object for modeling elements and the links between them. We can assume that where RAG is severely limited, having access to a document base via a raw vector base, the discovery and exploitation of links between graphically modeled information could greatly enrich the use of this knowledge.
Here, the approach is distinguished by the idea that a graph is an entity that is fairly easy to separate into sub-graphs or to aggregate. This approach will be particularly important if we are to have a hierarchical view of information: at high level, a global, summary view, but the ability to go down to low level to observe the fine relationships between each entity.
An important point to bear in mind before discussing the method: these fields of research are so recent that there are very few valid benchmarks for measuring their quality. This point is already a warning about the follow-up of these works, where a displayed score can be totally disconnected from the real results of a tool. But it’s also a reason why the authors have generated their own benchmark by generating case studies with LLMs. This encourages a degree of caution when it comes to generalizing this method.
The method is shown in the diagram below, which we will now describe in more detail:
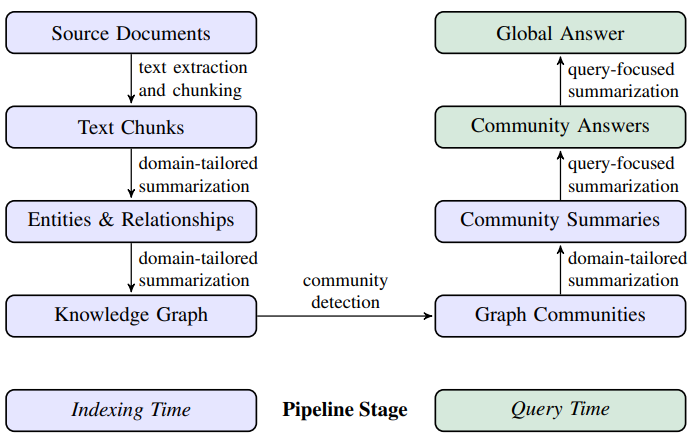
- Source Documents → Text Chunks : The division of documents into “chunkschunks” is a classic approach.
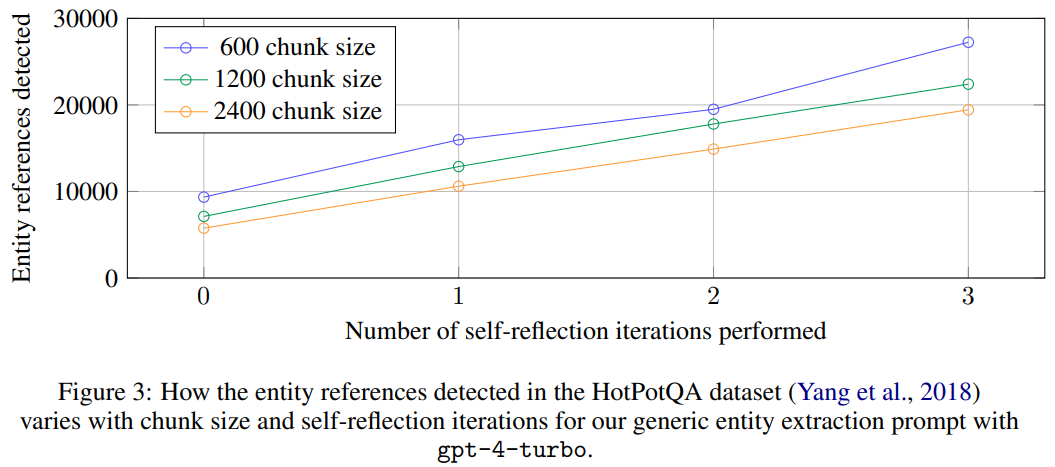
- Text Chunks → Entities & Relationships : Once thesechunksIn the case of “extracts”, an LLM will be queried specifically to extract, from each element, the entities discovered and the relationships between these entities. These approaches are similar to those used in causality research (see last article), which are known to be fallible. It’s interesting to note that the number of entities extracted evolves significantly with the number of LLM calls and the size of the LLM. chunk :
- Entities & Relationships → Knowledge Graph : Extractions are intended to be integrated into a global graph. Obviously, the same ” node“Each entity is represented by a context and a definition summary. Each entity is represented by a context and a summary of the entity’s definition.
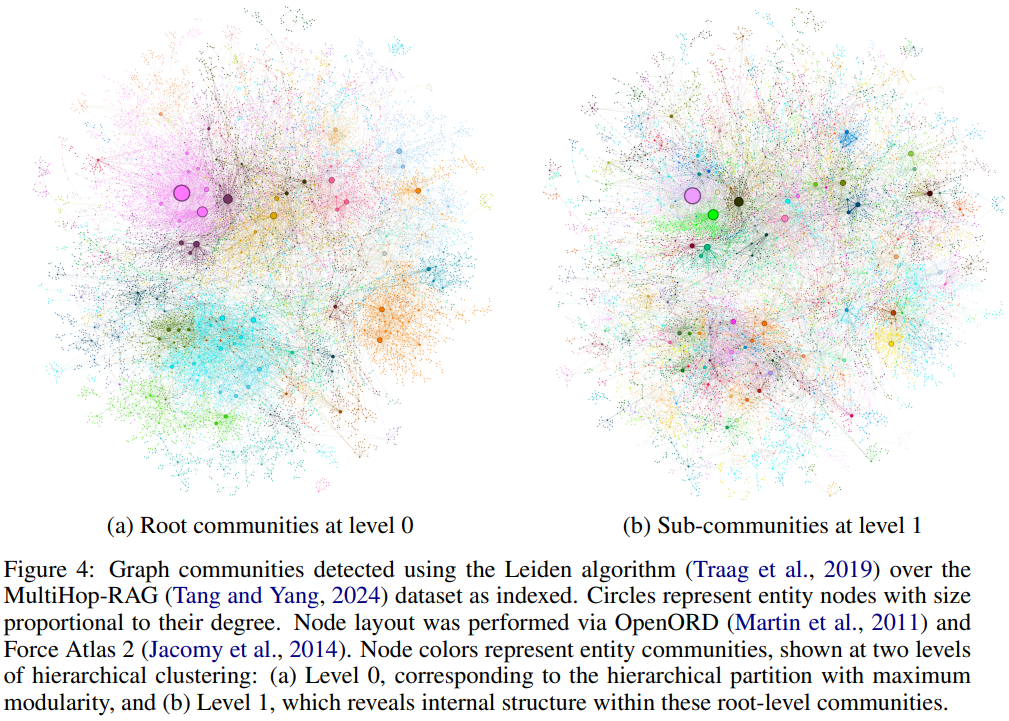
- Knowledge Graph → Graph Communities : This is a particularly interesting point. The generated graph is huge, and we won’t be able to work directly on it. Similarity algorithms will therefore aim to identify sub-graphs of elements that are very close to each other, in this case the ” Graph Communities“. This approach is recursive, giving the complete graph at one end, and a very global view of all the elements at the other. This approach generates a hierarchy of information. In the diagram below, we see on the left a very global partition (colors) with nodes (visible circles) that each represent an entry point into a “community”. On the right, we go down a level and gain in precision, where each “community” is itself a graph of sub-communities.
- Graph Communities → Community Summaries Each community (at each hierarchical level) will be represented by a summary. At a fine level, this summary will be a representation of the node’s information. At a higher level, the children’s summaries will be aggregated.
- Community Summaries → Community Answers When faced with a question, a LLM will be used to compare the summaries of each community to the question. An aggregation is then set up to generate the LLM response context.
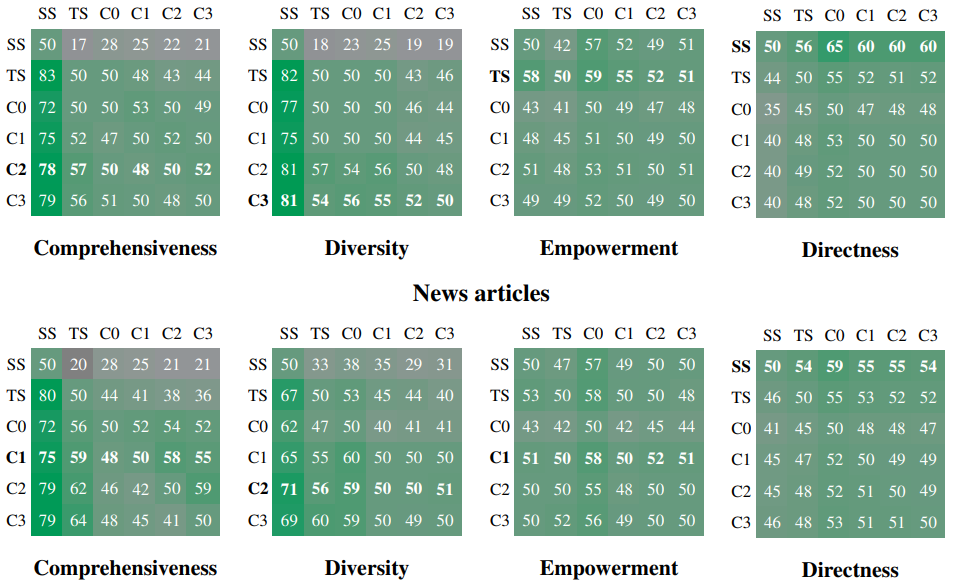
With regard to the results that we will present next, let us recall that the dataset dataset is generated by calling an LLM through the use of “Personas“. But more dangerously, the numerical results also come from a call to an LLM who will compare different answers to assess a score. These criteria relate to comprehension (how many details are given in the answer, and do these details cover the scope of the question), diversity (richness of the answer) and effectiveness. Let’s take a step back from the results, which, while interesting, are still dangerous to evaluate.
The diagram below shows, for each pair of approaches, the number of times one approach scored better than the second. For example, in Diversity, the “TS” approach scores better than the “SS” approach 82% of the time. The approaches here are C0 to C3: different declinations of the GraphRag where only one hierarchical level of the selected graph is used, TS a simplified approach and SS the “classic” RAG approach:
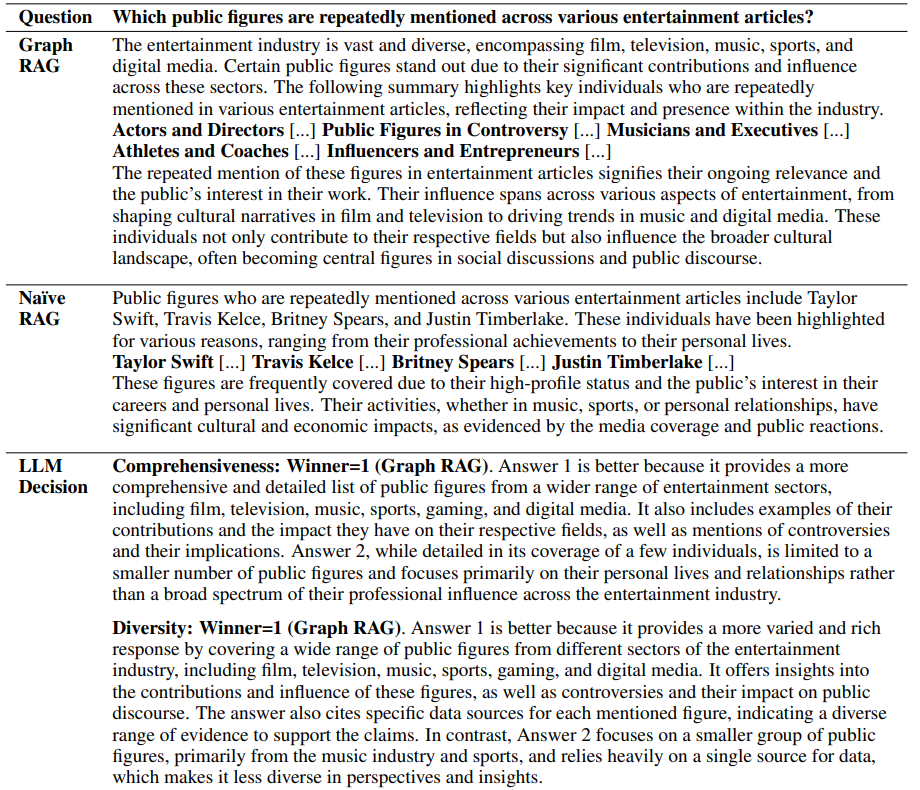
Finally, to illustrate, you will find below a question, the answer GraphRAGanswer, the classic RAG answer, and the LLM “decision”:
Medical Graph RAG: Towards Safe Medical Large Language Model via Graph Retrieval-Augmented Generation
Microsoft’s GraphRAG launched a whole new field of research, with a tasty promise for RAG galley dwellers: discover and exploit relationships between the information discovered to accompany the answer. More than a hundred works have been published in the wake of this initiative, proposing adaptations and evolutions. We now propose to focus on a particularly interesting specialization of the approach, for two reasons:
- The field concerned here is the medical sector, which is particularly demanding in terms of the quality and precision of its answers.
- This specialization provides us with an interesting insight into how to move away from the generic approach proposed by Microsoft. In artificial intelligence, it is extremely rare to be able to directly apply an academic approach without adapting it to the target problem. This example is therefore invaluable 🙂
Another important element here is to use external knowledge already available, in conjunction with the target document base. The medical world is full of exact and precise definitions, taxonomies and the like that can accompany the RAG approach. Finally, the authors emphasize that the GraphRAGespecially the generation of the various hierarchical communities in the graph, is particularly time-consuming.
So what’s behind this new specialized approach? The diagram below gives an overview, which we’ll take a moment to unpack 🙂
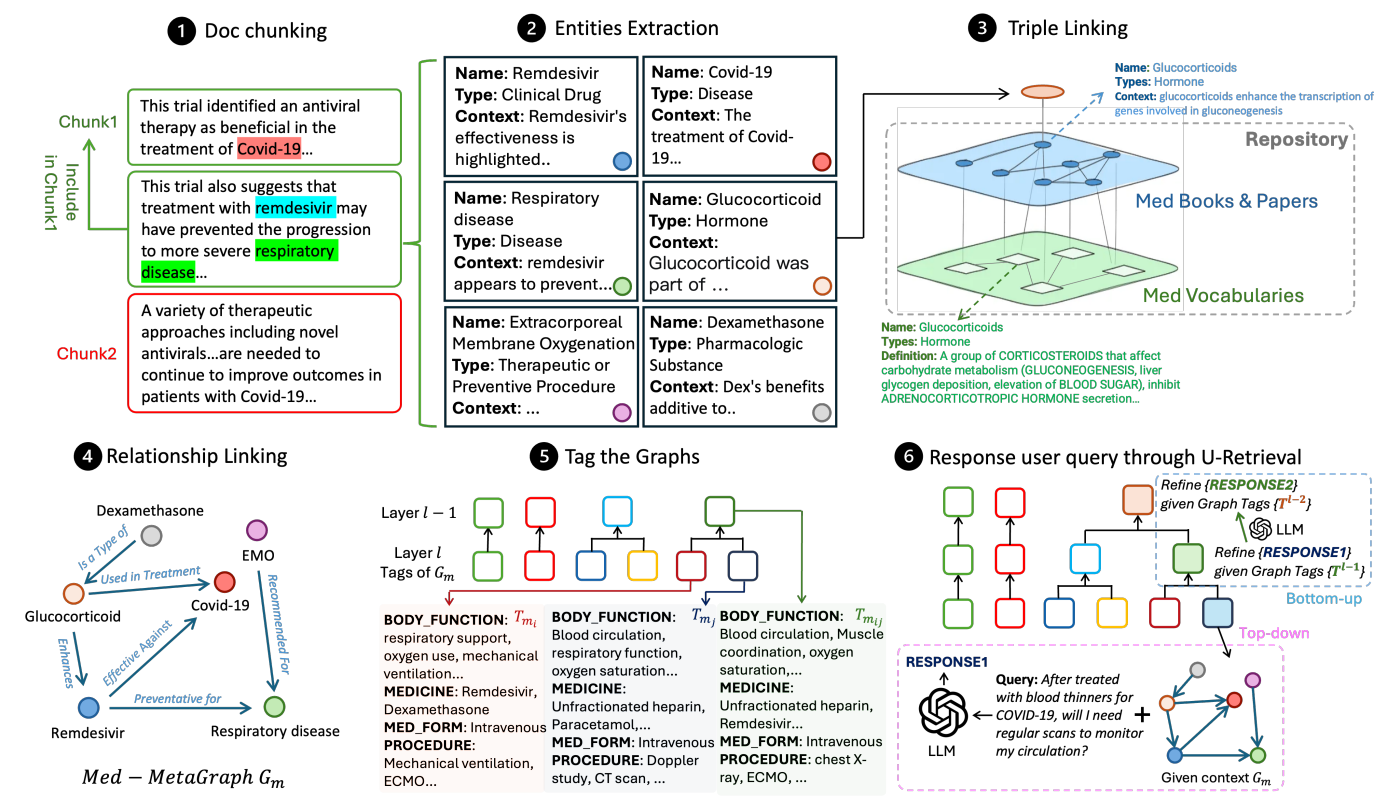
- Semantic Document Chunking Always a must, the chunking of the document base is a little more advanced. Beyond the chunking “(based on a maximum length), the authors here exploit an LLM to measure semantic consistency between one line and the next. The idea is to have chunks that are as consistent as possible inside. A sliding window is used to avoid sharp cuts.
- Entities Extraction Feature extraction remains central to these approaches. This extraction is always carried out via a specially instrumented LLM. The extracted text represents an entity by aggregating its name, its type (as determined by the LLM) and a description of the context in which the entity was discovered.
- Triple Linking This is where the specific comes into its own. Three different graphs will exist, the first two being generic whatever the target documentation, and the third generated from the document base. The first graph exploits a database of scientific medical publications, and the second a specialized medical dictionary. By means of similarity searches, the elements of the two graphs will be linked together, and then linked to the graph containing the entities extracted from the documentation being processed. The idea here is to exploit cross-disciplinary, validated knowledge bases, which are condensed into ” Knowledge Graph“You can then apply the graph discovered in the documentation.
- Relationship Linking Each pair of elements in the global graph will be queried (once again via an LLM), to qualify the link (if any) between the two elements.
- Tag the Graphs The challenge here is not to reproduce the “Graph Communities” discovery.Graph Communities“generated by GraphRAG original. The authors exploit a database of tags (classifications) already existing in the medical field, and start by applying the corresponding tag to each node in the graph. An algorithm then works its way up to larger and larger sub-graphs, generating “summary” tags for sub-groups of nodes with similar tags.
- Answer to a question When faced with a request, the approach will already identify the most important tags. These will be used to select the most relevant sub-graph. The elements selected will be used as the context for the LLM response.
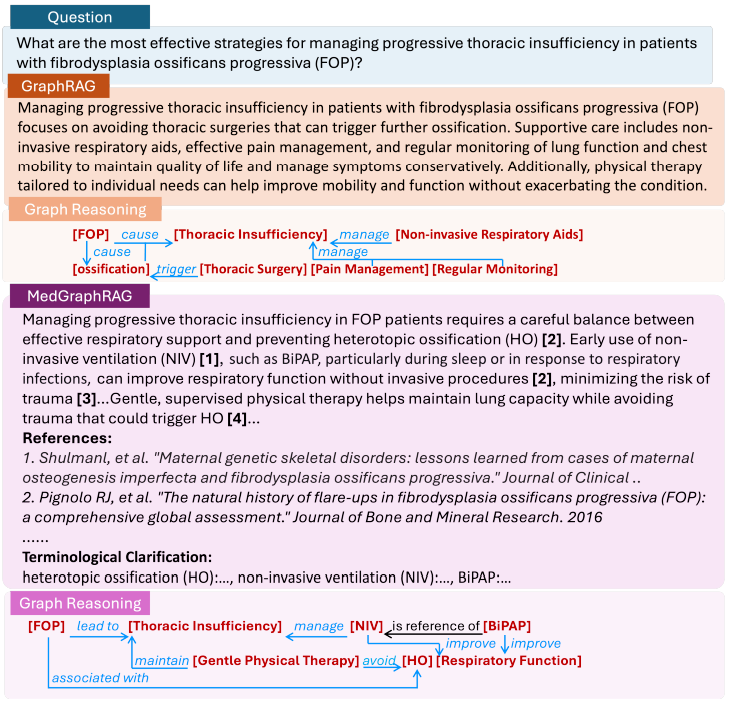
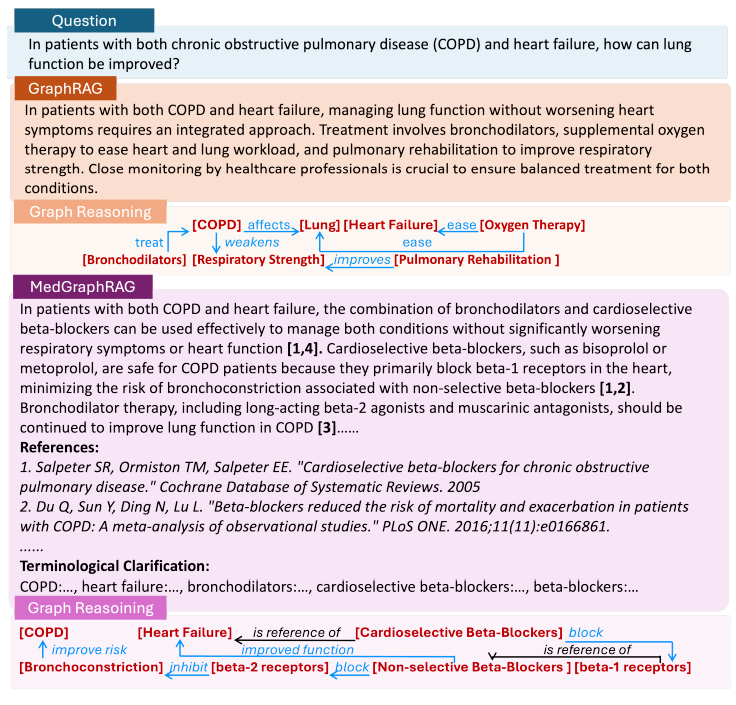
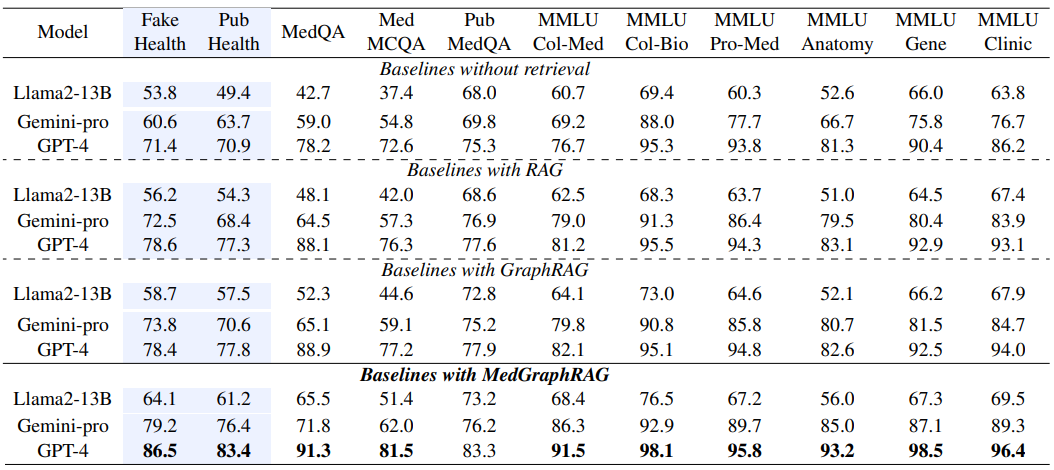
The diagram below shows two examples of questions and answers, with a comparison between the original GraphRAG and this specialized version.
The results below present the results of different approaches, from simple LLM queries to this specific approach. These results also show that, in terms of “raw” results, these approaches are not so revolutionary. It’s more in the ability to expose the graph to a third-party user that these approaches gain in relevance, by partially exposing how the search works.
Large Language Models based Graph Convolution for Text-Attributed Networks, Zhou et al.
This latest work, presented at ICLR 2025, is an opportunity to observe a rather different, yet classic approach in the field. Indeed, even if we have to work on graphs, couldn’t we use Deep Learning models that specialize in graph management, the aptly named Graph Neural Networks (GNNs)? While the arrival of LLMs had the effect of a groundswell on Deep Learning research as a whole, over time, different (and in many cases, more relevant) approaches are coming to the fore, if only to explore our ability to compare and even mix these techniques with one another.
The original problem (there’s always a problem) is that GNN approaches have a vision of the links between elements but remain rather blind to the textual content of each element.
Here, the researchers will put the two approaches in competition, initially with a graph composed of text resources (Text Attributed Graph):
- The semantic approach (at the top of the graph) or via embeddings and a similarity calculation, the most interesting elements will be retained.
- The structural approach, which looks for the most relevant graph nodes to retain from a source node.
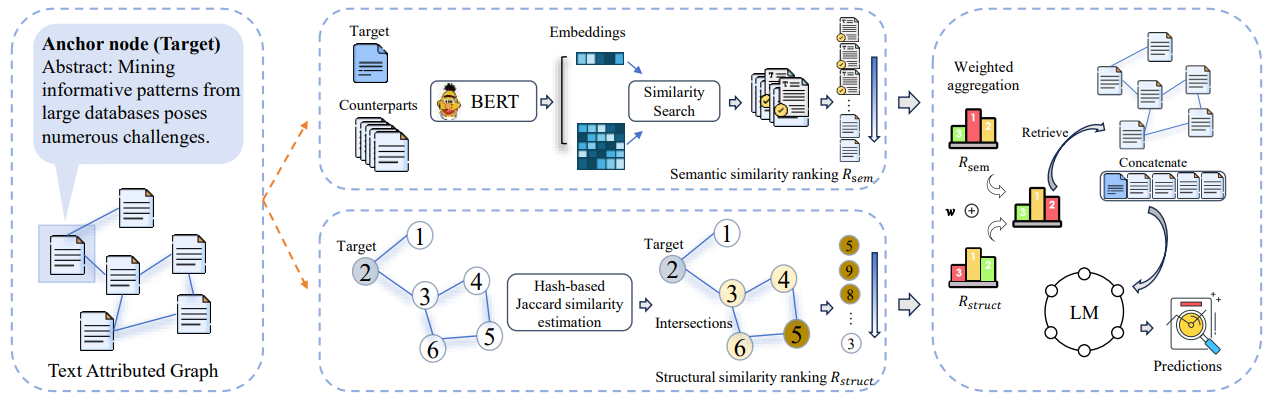
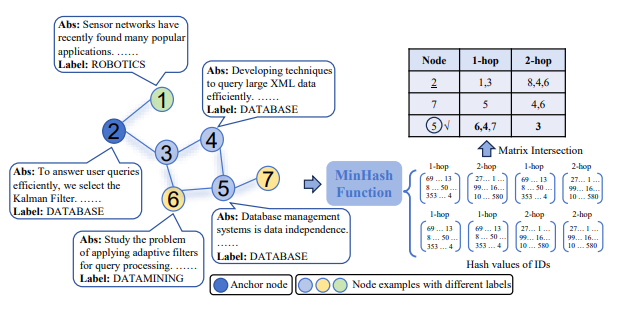
The structural approach compares nodes by comparing the common neighbors of two nodes to estimate their proximity. Two nodes in the graph are considered to be closer the more neighboring nodes they have in common (direct or indirect neighbors). In the example below, the source node (node 2) is considered to have node 5 as its nearest neighbor.
Conclusion
Visit GraphRAG is still a very recent field, if not too recent. The original approach is extremely cumbersome, and when it comes to synthetically generating a benchmark and use LLMs as metrics, we can assume that the approach is too young to be properly qualified.
Visit GraphRAG does not solve all RAG We’re still using a massive approach, with real measurement and testing difficulties, and no immediate corrective solutions. On the other hand, the use or generation of knowledge graphs is a very relevant approach for modeling knowledge (and getting out a better information path than a simple list of stored vectors) as well as for exposing information to the user.
We’re continuing to monitor the field, and have already been able to draw on this work to improve our solutions. 😊